Altcoin Market Update #135
Features analysis on Altcoins such as ETH AAVE LINK VIRTUAL XMR NPC
Hello and welcome back to the Rekt Capital Newsletter
In today’s edition, the following cryptocurrencies will be analysed & discussed:
- Ethereum (ETH)
- Aave (AAVE)
- Chainlink (LINK)
- Virtuals Protocol (VIRTUAL)
- Monero (XMR)
- Non-Playable Coin (NPC)
But before we dive in, this Friday I’ll chart your Altcoin picks in an exclusive subscriber-only TA newsletter and will cover as many as I can
So if you’d like to have an Altcoin charted, feel free to share max. two TA requests each in the comments below.
I’ll chart the Altcoins that get mentioned and ‘Liked’ the most
Click the button below to leave a comment with your TA request!
Let's dive in to today's Altcoin Market Update.
Ethereum – ETH/USD
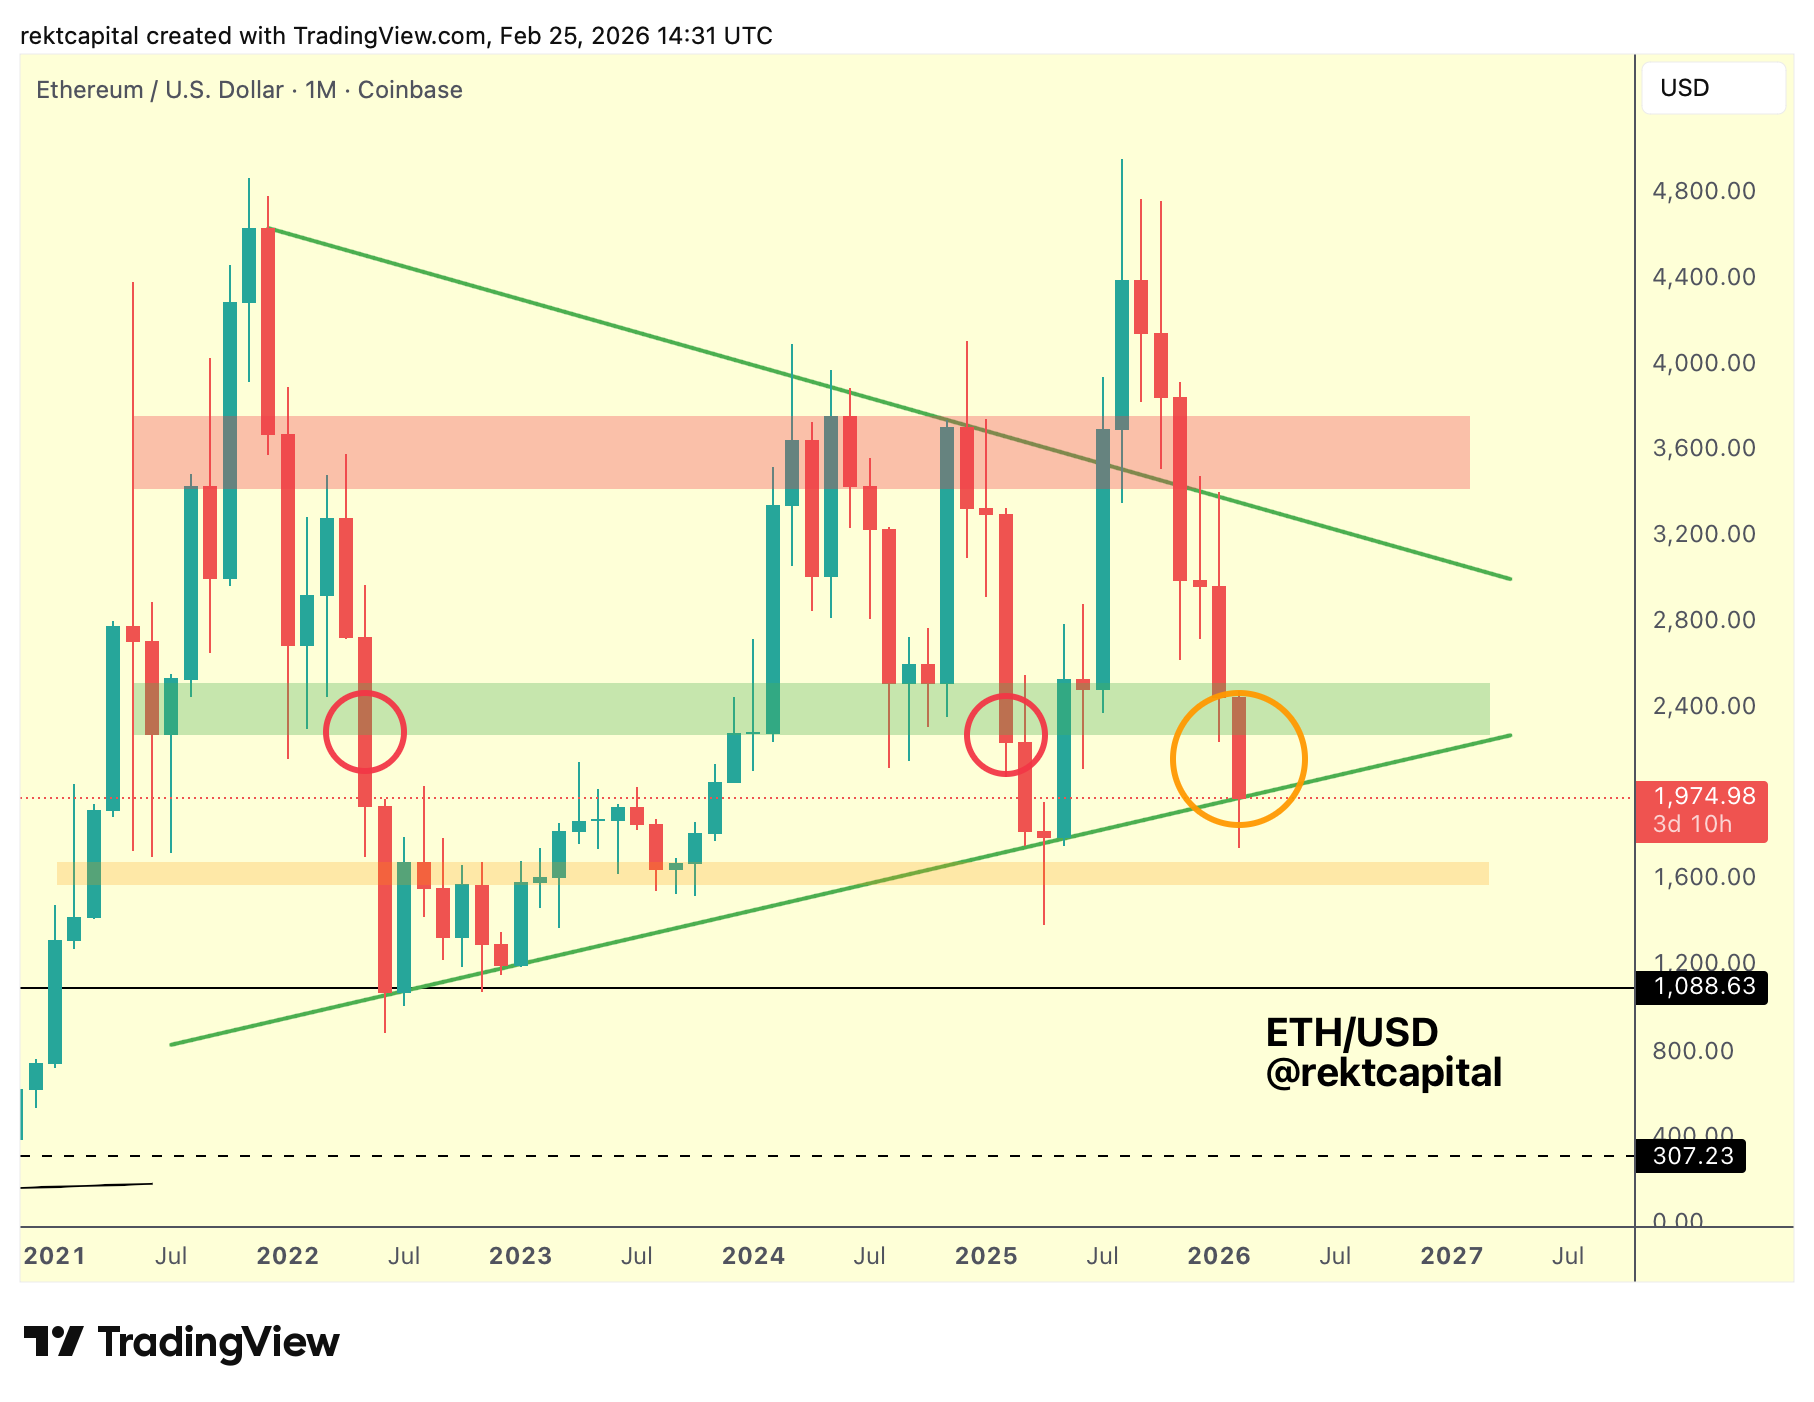
Ethereum is currently positioned at its multi-year trendline, a structural level that has defined the broader macro trajectory for several years.
If Ethereum Monthly Closes above this trendline (green ascending trendline, multi-year uptrend support), then price would have scope to rebound into the green region overhead.
However, that green region (green horizontal zone, historical supply) has not historically been kind to Ethereum across cycles.
In 2022, price broke below this region and continued lower. In 2025, price Monthly Closed below it, turned it into resistance, and continued lower once again.
So structurally, the green region remains a likely candidate for resistance unless Ethereum Monthly Closes above it and successfully turns it into support, similar to what occurred in early 2025.
But given current Bear Market conditions, that scenario appears less likely at this point in time.
Let’s see what the Monthly Close brings.
If Ethereum Monthly Closes above the multi-year trendline, then the green region could indeed become the next upside objective as part of a relief rally.
However, if Ethereum Monthly Closes below the trendline, then the orange region (orange horizontal zone, prior demand cluster) could be revisited once again.
We have already seen downside wicking toward that orange region, but not a clean, picture-perfect retest.
Losing the trendline would likely force price into that orange region more decisively and potentially even result in its loss as support.
Because if a macro uptrend is lost, then there is limited buy-side momentum supporting price against further downside over time.
Aave – AAVE/USDT
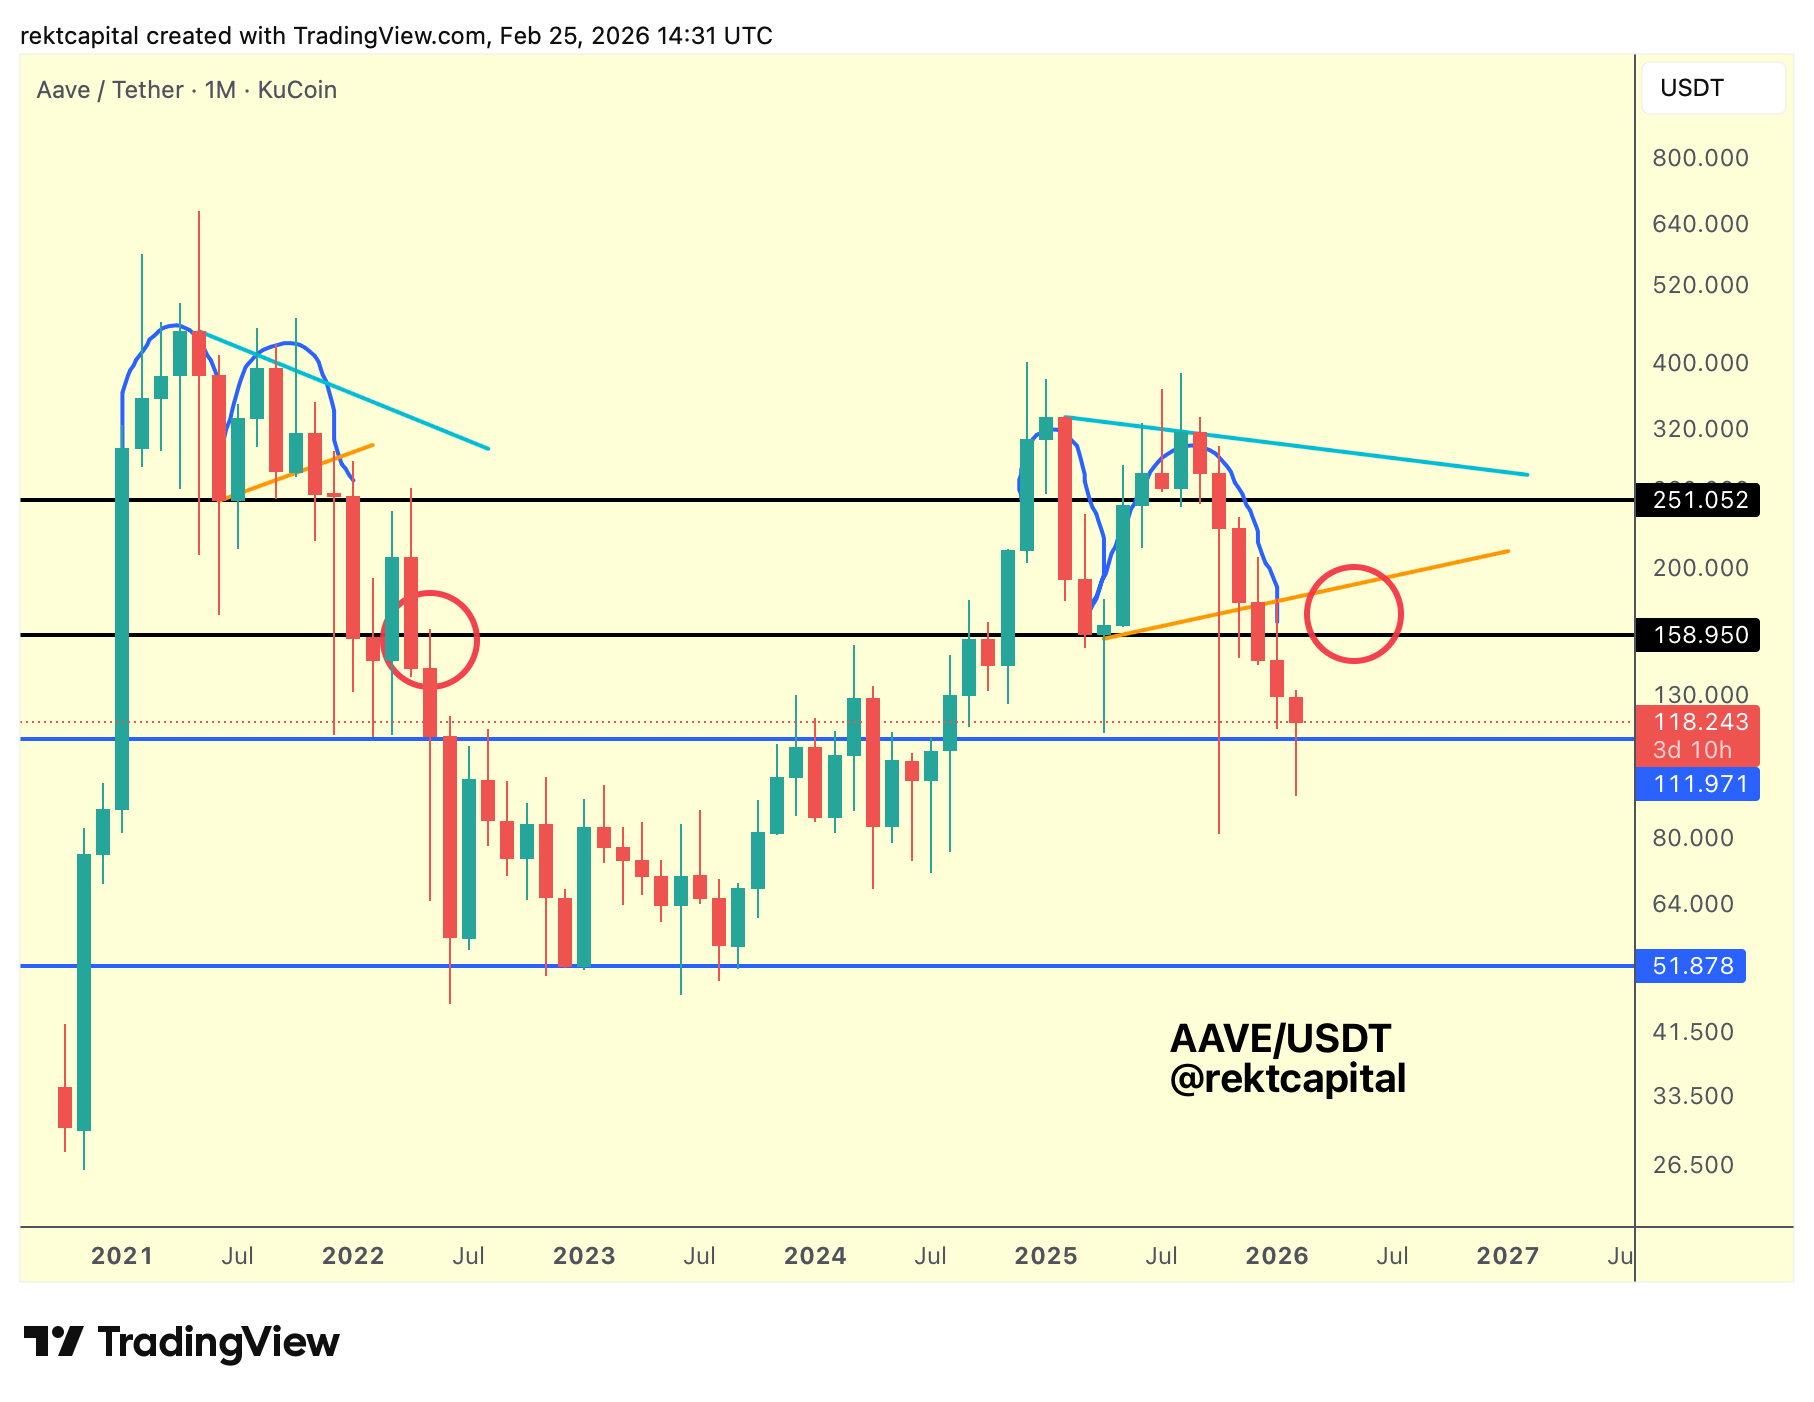
Aave has already seen the 2021–2022 fractal play out, with the breakdown now confirmed and price rebounding from $111.971 (blue horizontal, range support).
That rebound could extend into $158.950 (black horizontal, range high). If we were to see stronger bullish price action and some degree of overextension, then there is scope for a move toward the orange trendline (orange ascending diagonal, reclaim attempt area).
However, it appears unlikely that upside would expand meaningfully into that trendline at this stage, though it remains a scenario to stay open to.
Structurally, Aave is trading within a broader $111.971–$158.950 range, and this range-bound behaviour looks increasingly probable.
That is precisely what occurred in 2022 following the breakdown, and current conditions suggest a similar sequence could unfold going forward.