Altcoin Market Update #129
Features analysis on Altcoins such as XMR LINK RENDER FARTCOIN WIF SPX
Hello and welcome back to the Rekt Capital Newsletter
In today’s edition, the following cryptocurrencies will be analysed & discussed:
- Monero (XMR)
- Chainlink (LINK)
- Render (RENDER)
- Fartcoin (FARTCOIN)
- dogwifhat (WIF)
- SPX6900 (SPX)
But before we dive in, this Friday I’ll chart your Altcoin picks in an exclusive subscriber-only TA newsletter and will cover as many as I can
So if you’d like to have an Altcoin charted, feel free to share max. two TA requests each in the comments below.
I’ll chart the Altcoins that get mentioned and ‘Liked’ the most
Click the button below to leave a comment with your TA request!
Let's dive in to today's Altcoin Market Update.
Monero – XMR/USDT
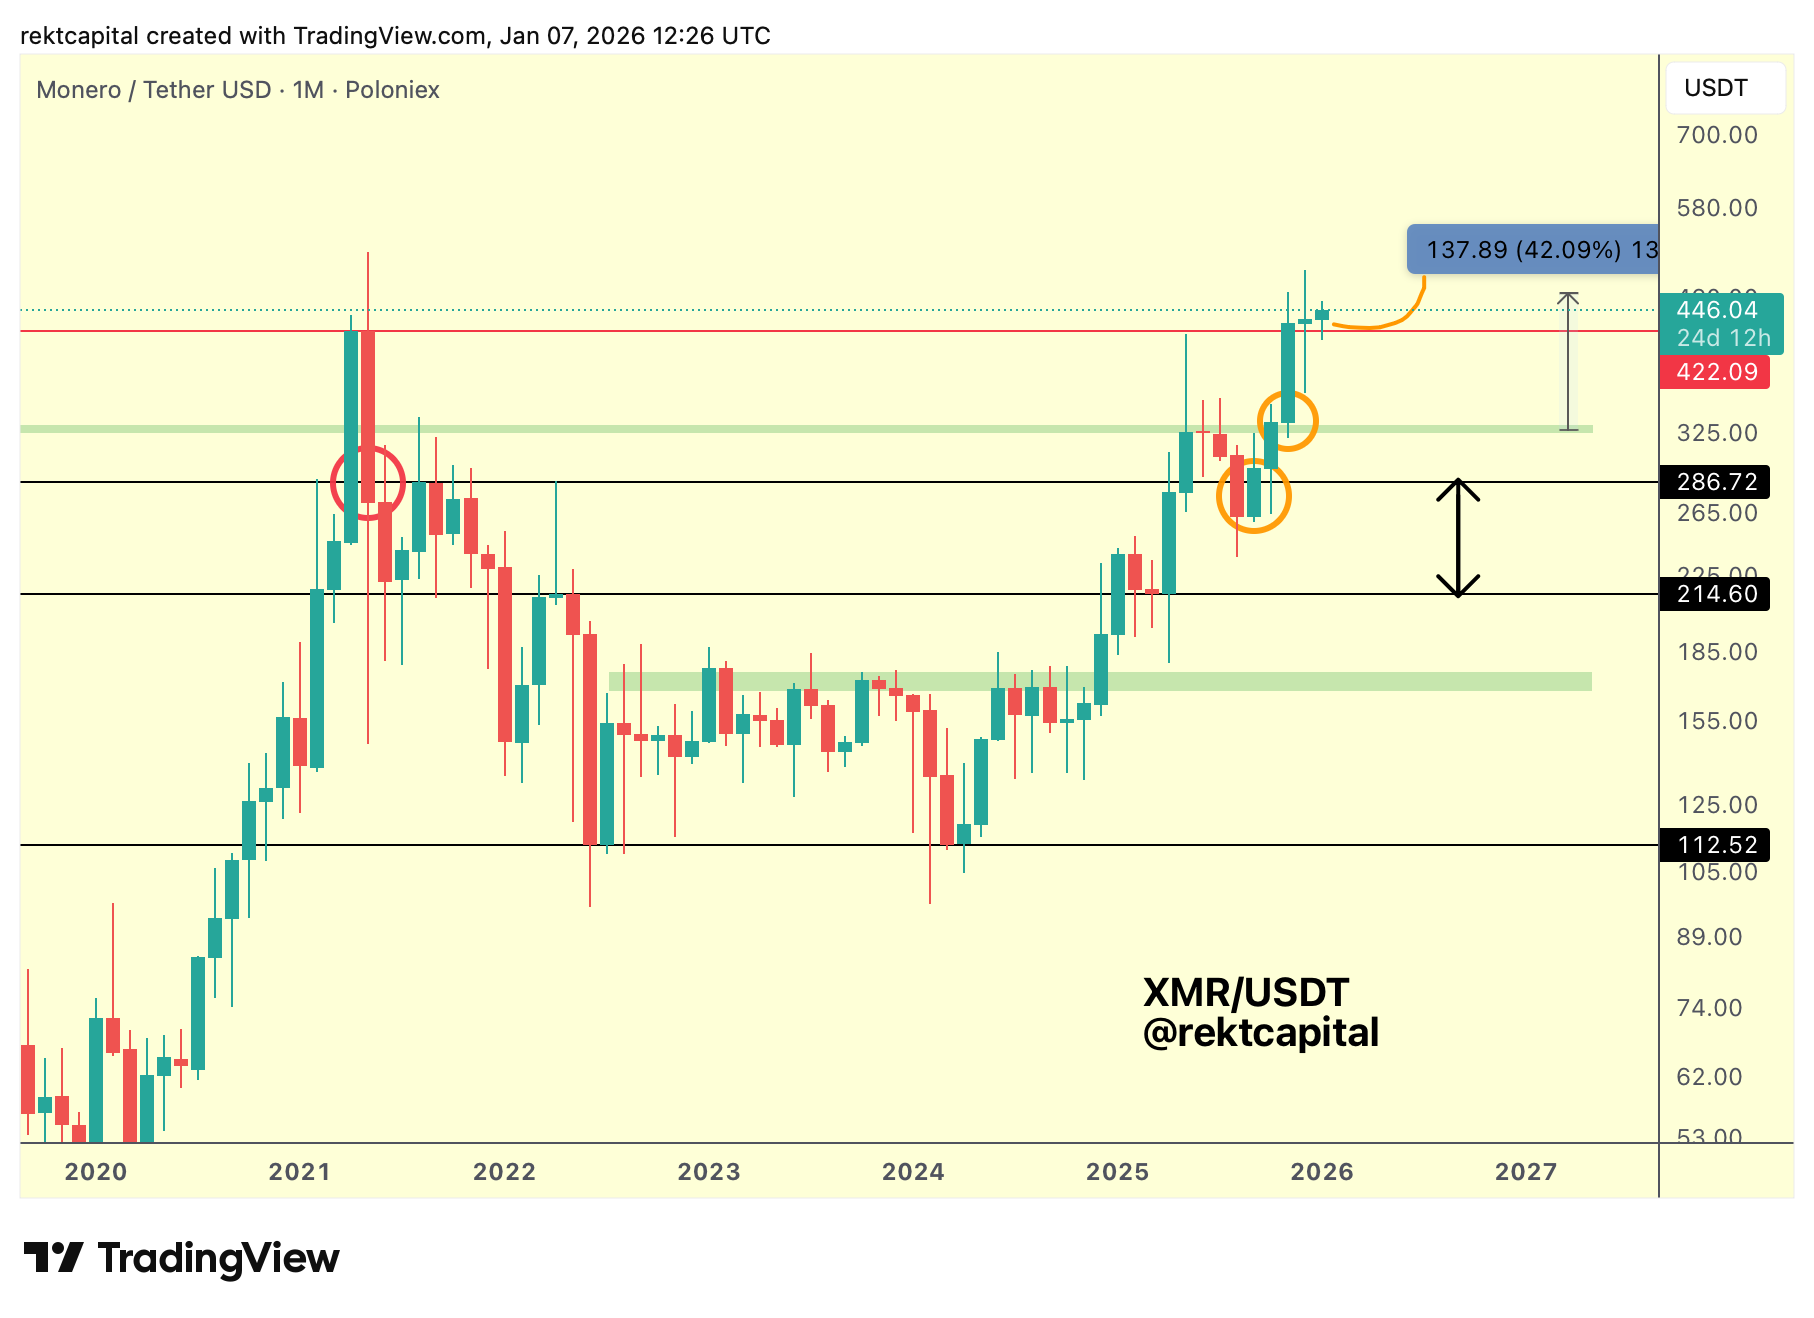
As discussed last week, XMR had been positioning for a retest of former resistance into new support, with price spending roughly three consecutive Monthly Closes holding above $422.09 (red horizontal).
That sustained acceptance proved decisive.
By repeatedly defending that level, XMR was able to transition former resistance into support, setting the conditions for continuation rather than rejection.
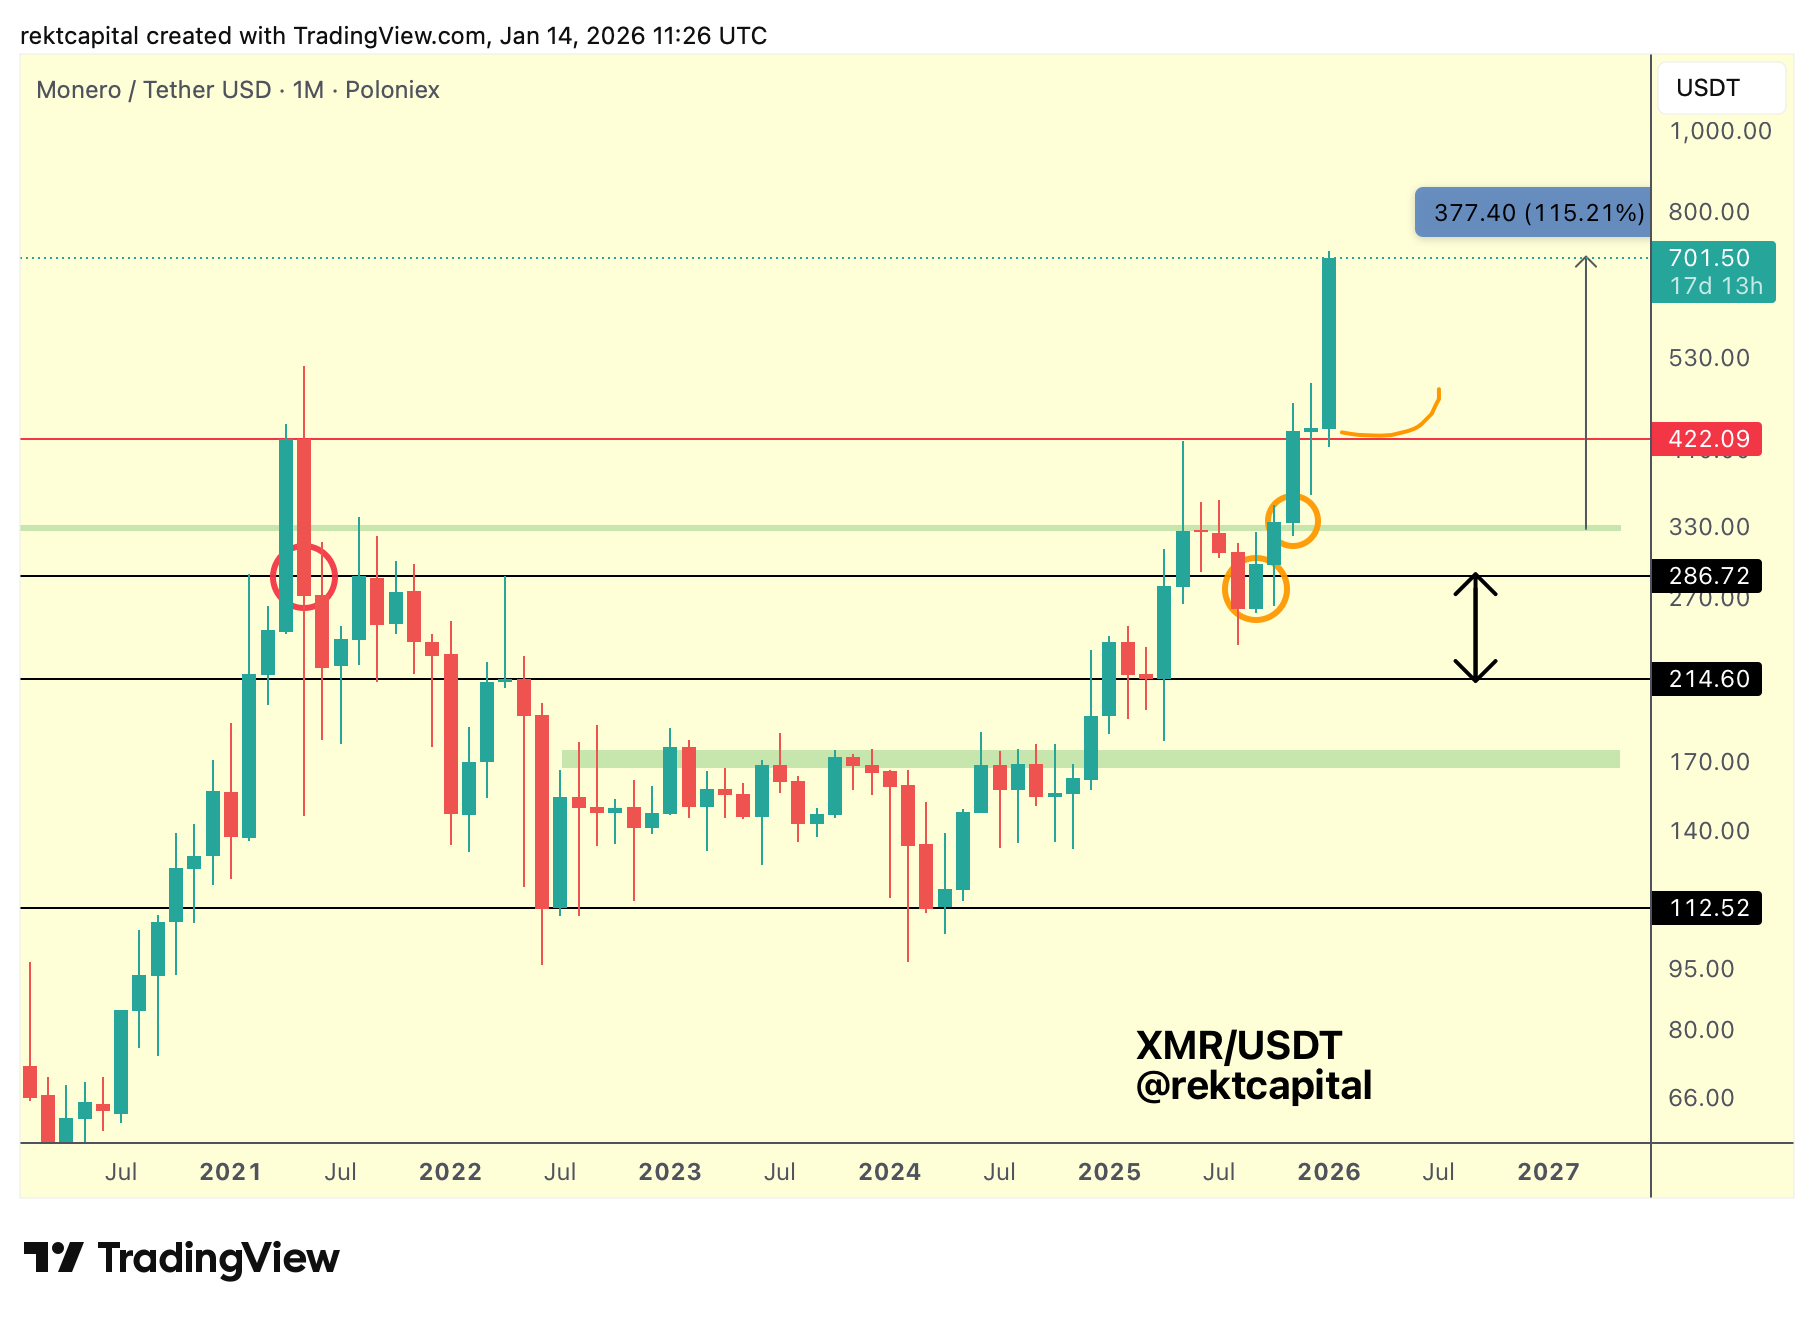
That process has now enabled a breakout into Price Discovery, carrying XMR into new All Time Highs and confirming that the higher-timeframe structure has shifted constructively.
This rally, however, has only just begun.
Going forward, the key requirement is maintenance of current price levels, as early-stage Price Discovery phases often remain volatile but strongly bid.
On any pullback, the nearest meaningful reference is the psychological $500 region, which also aligns with prior upside-wicking behaviour and therefore represents the closest potential support on dips.
That said, given how recently XMR has broken out, downside retracements are likely to attract aggressive buy-side interest, making a deeper revisit toward $500 less probable in the near term.
In that sense, the structure remains tilted toward continuation, with pullbacks viewed through the lens of support formation rather than trend failure, as long as the broader Price Discovery context remains intact.
Chainlink – LINK/USDT
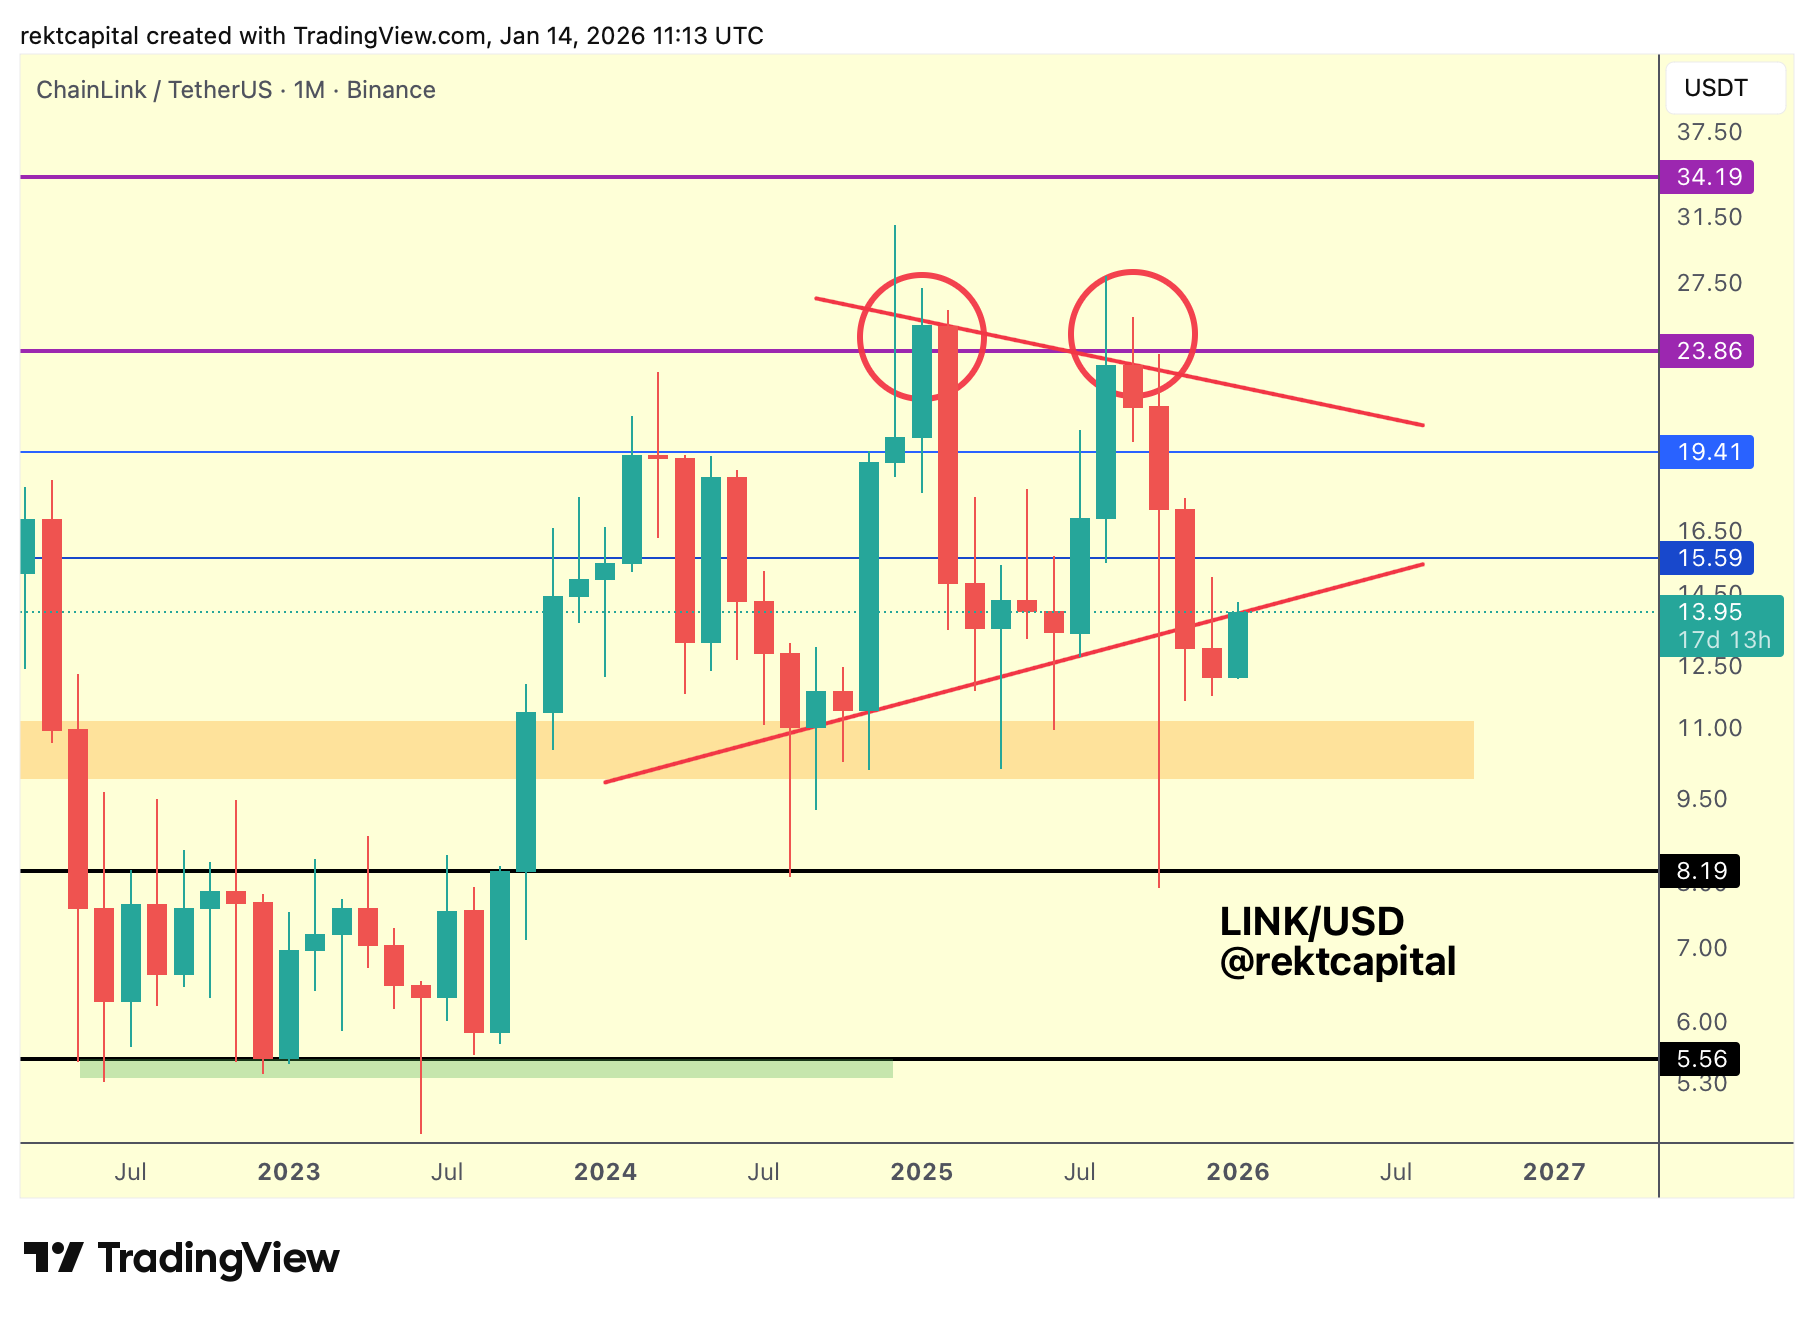
On the higher timeframe, Chainlink continues to trade within a broader macro triangle, a structure that has historically allowed for sizable internal moves without immediately resolving directionally.
In recent memory, however, price has not simply bounced from the base of that triangle.
Instead, we have seen a Monthly Close and subsequent tagging of this region, introducing the risk that what was previously support may now be transitioning into potential new resistance.
That shift is important, as it explains why upside progress has become more laboured rather than impulsive.
That said, the structure is not yet locked in.
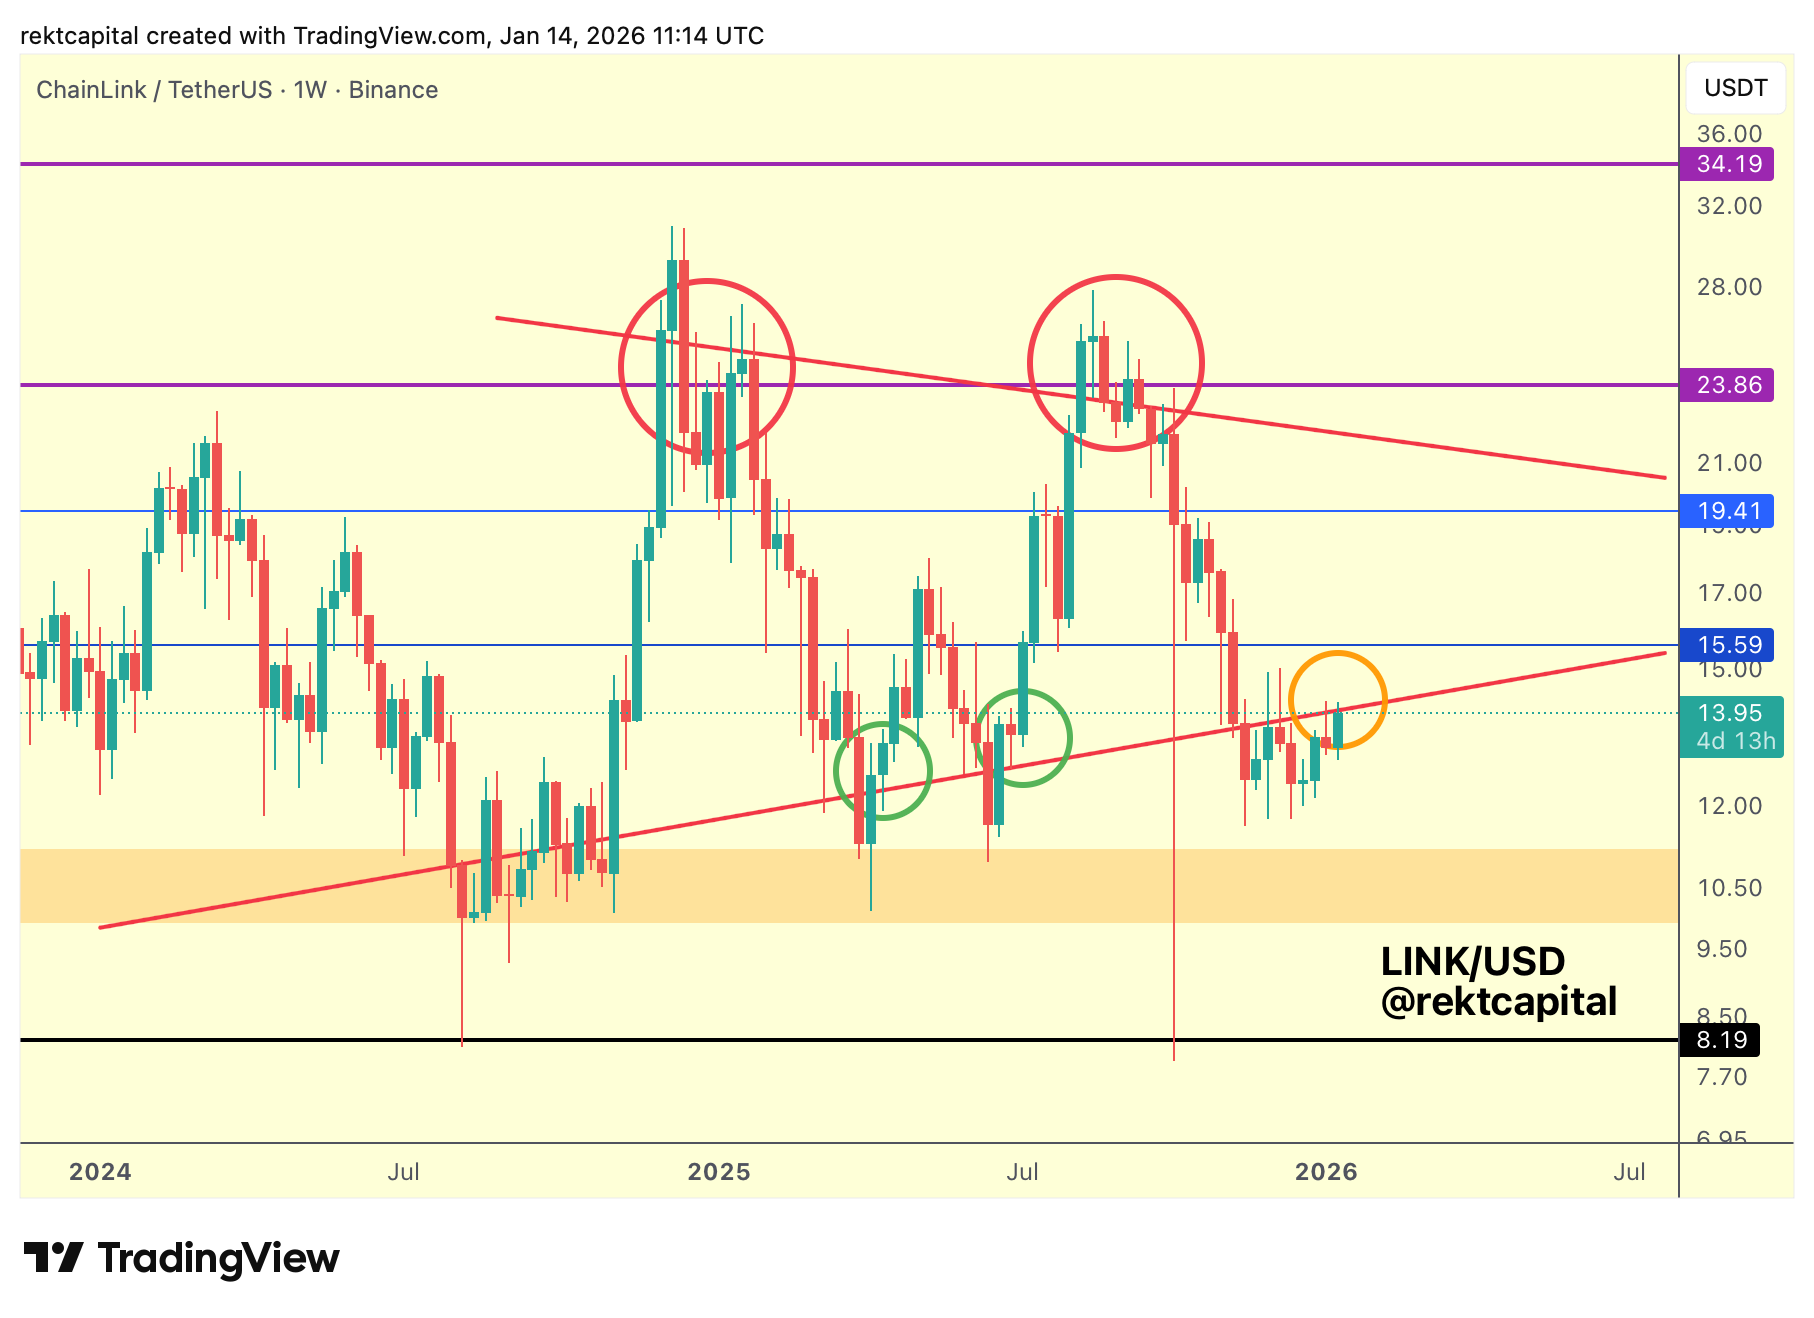
Going forward, the Monthly picture could still evolve if LINK is able to produce a Weekly Close above the Higher Low, followed by a successful retest of that level into new support, similar to what occurred on two separate occasions in 2025 (green circles).
If that sequence unfolds, price would effectively resynchronise with the macro triangle, reopening the range of possibilities inside the pattern itself.
Under that scenario, LINK could even consolidate across the triangle rather than immediately trending higher.
However, even in such a case, any lesser rally would still risk producing yet another macro Lower High, keeping the broader structure constrained.
Chainlink’s structure currently resembles more of a Double Bottom, a pattern also observed recently in Ethereum.
As a result, LINK is now attempting to reverse and reclaim this Higher Low as support, with upcoming Weekly Closes determining whether this recovery attempt can stabilise or fades back into structural weakness.