Altcoin Market Update #128
Features analysis on Altcoins such as SPX XLM AERO XMR FARTCOIN VIRTUAL
Hello and welcome back to the Rekt Capital Newsletter
In today’s edition, the following cryptocurrencies will be analysed & discussed:
- SPX6900 (SPX)
- Stellar (XLM)
- Aerodrome Finance (AERO)
- Monero (XMR)
- Fartcoin (FARTCOIN)
- Virtuals Protocol (VIRTUAL)
But before we dive in, this Friday I’ll chart your Altcoin picks in an exclusive subscriber-only TA newsletter and will cover as many as I can
So if you’d like to have an Altcoin charted, feel free to share max. two TA requests each in the comments below.
I’ll chart the Altcoins that get mentioned and ‘Liked’ the most
Click the button below to leave a comment with your TA request!
Let's dive in to today's Altcoin Market Update.
SPX6900 – SPX/USDT
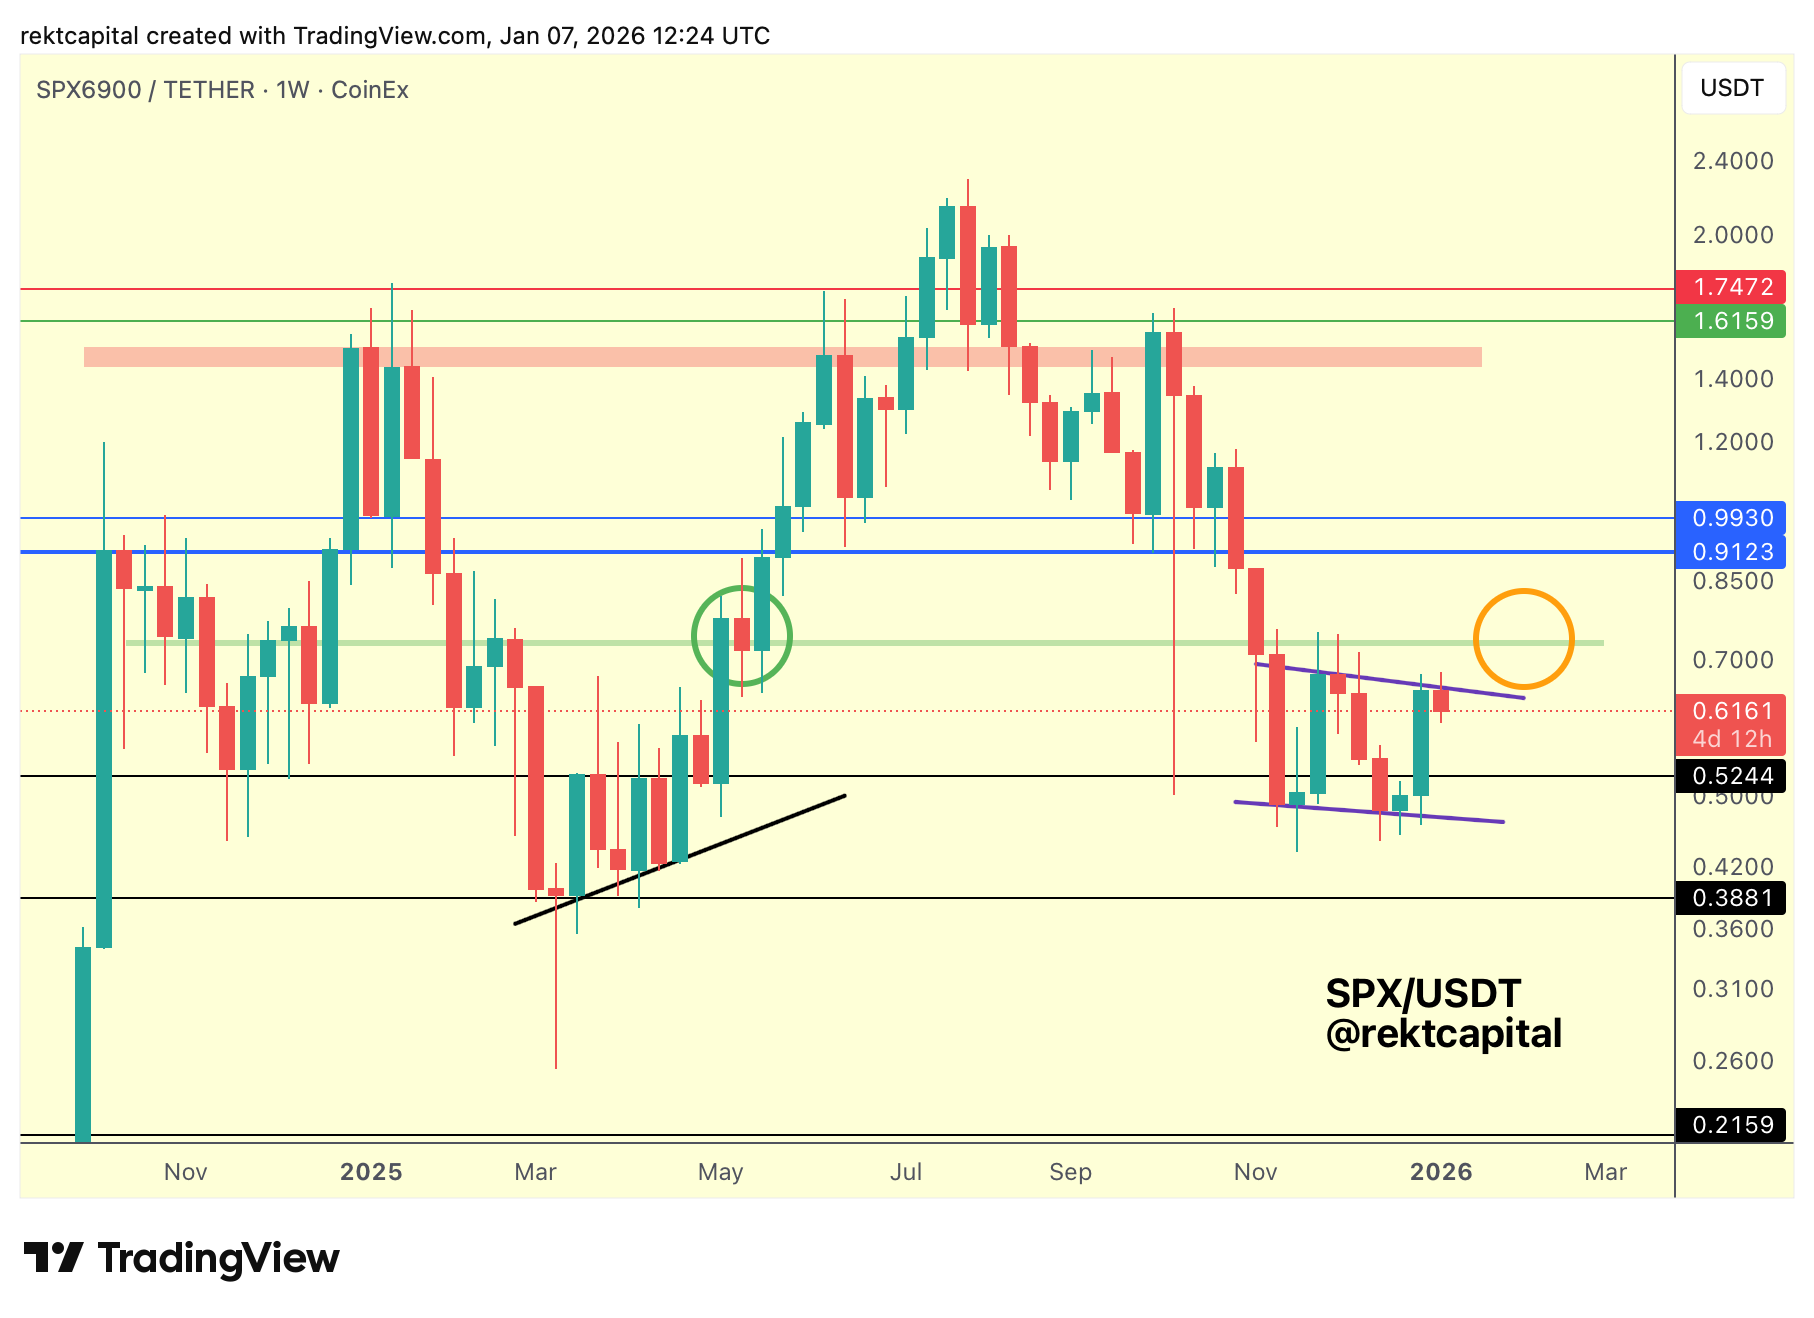
We have been tracking SPX over recent weeks, with price continuing to develop inside a broader consolidation structure rather than resolving directionally.
On the Weekly timeframe, price is printing a sequence of Lower Highs and Lower Lows, compressing into a wedge that remains largely contained within the $0.52–$0.75 range.
Within that structure, the most recent Lower Low in price has occurred alongside a Higher Low in RSI, opening the door to a potential Bullish Divergence developing as momentum weakens on the downside.
However, this remains a secondary signal rather than a structural shift, as trend bias is still governed by price.
For any meaningful change in bias to occur, SPX would need to Weekly Close above the Lower High and re-enter the green region of resistance, as prior Weekly Closes followed by retests of this region have historically enabled continuation (as per green circle in mid-2025).
As long as price remains below the top of the pattern, consolidation within the structure is likely to continue, leaving scope for further ranging and even a revisit toward $0.52 or the lower boundary of the wedge.
Only sustained stability near current levels, followed by a Weekly Close above the Lower High of the pattern, would reduce downside risk and allow bullish bias to re-emerge.
Stellar – XLM/USDT
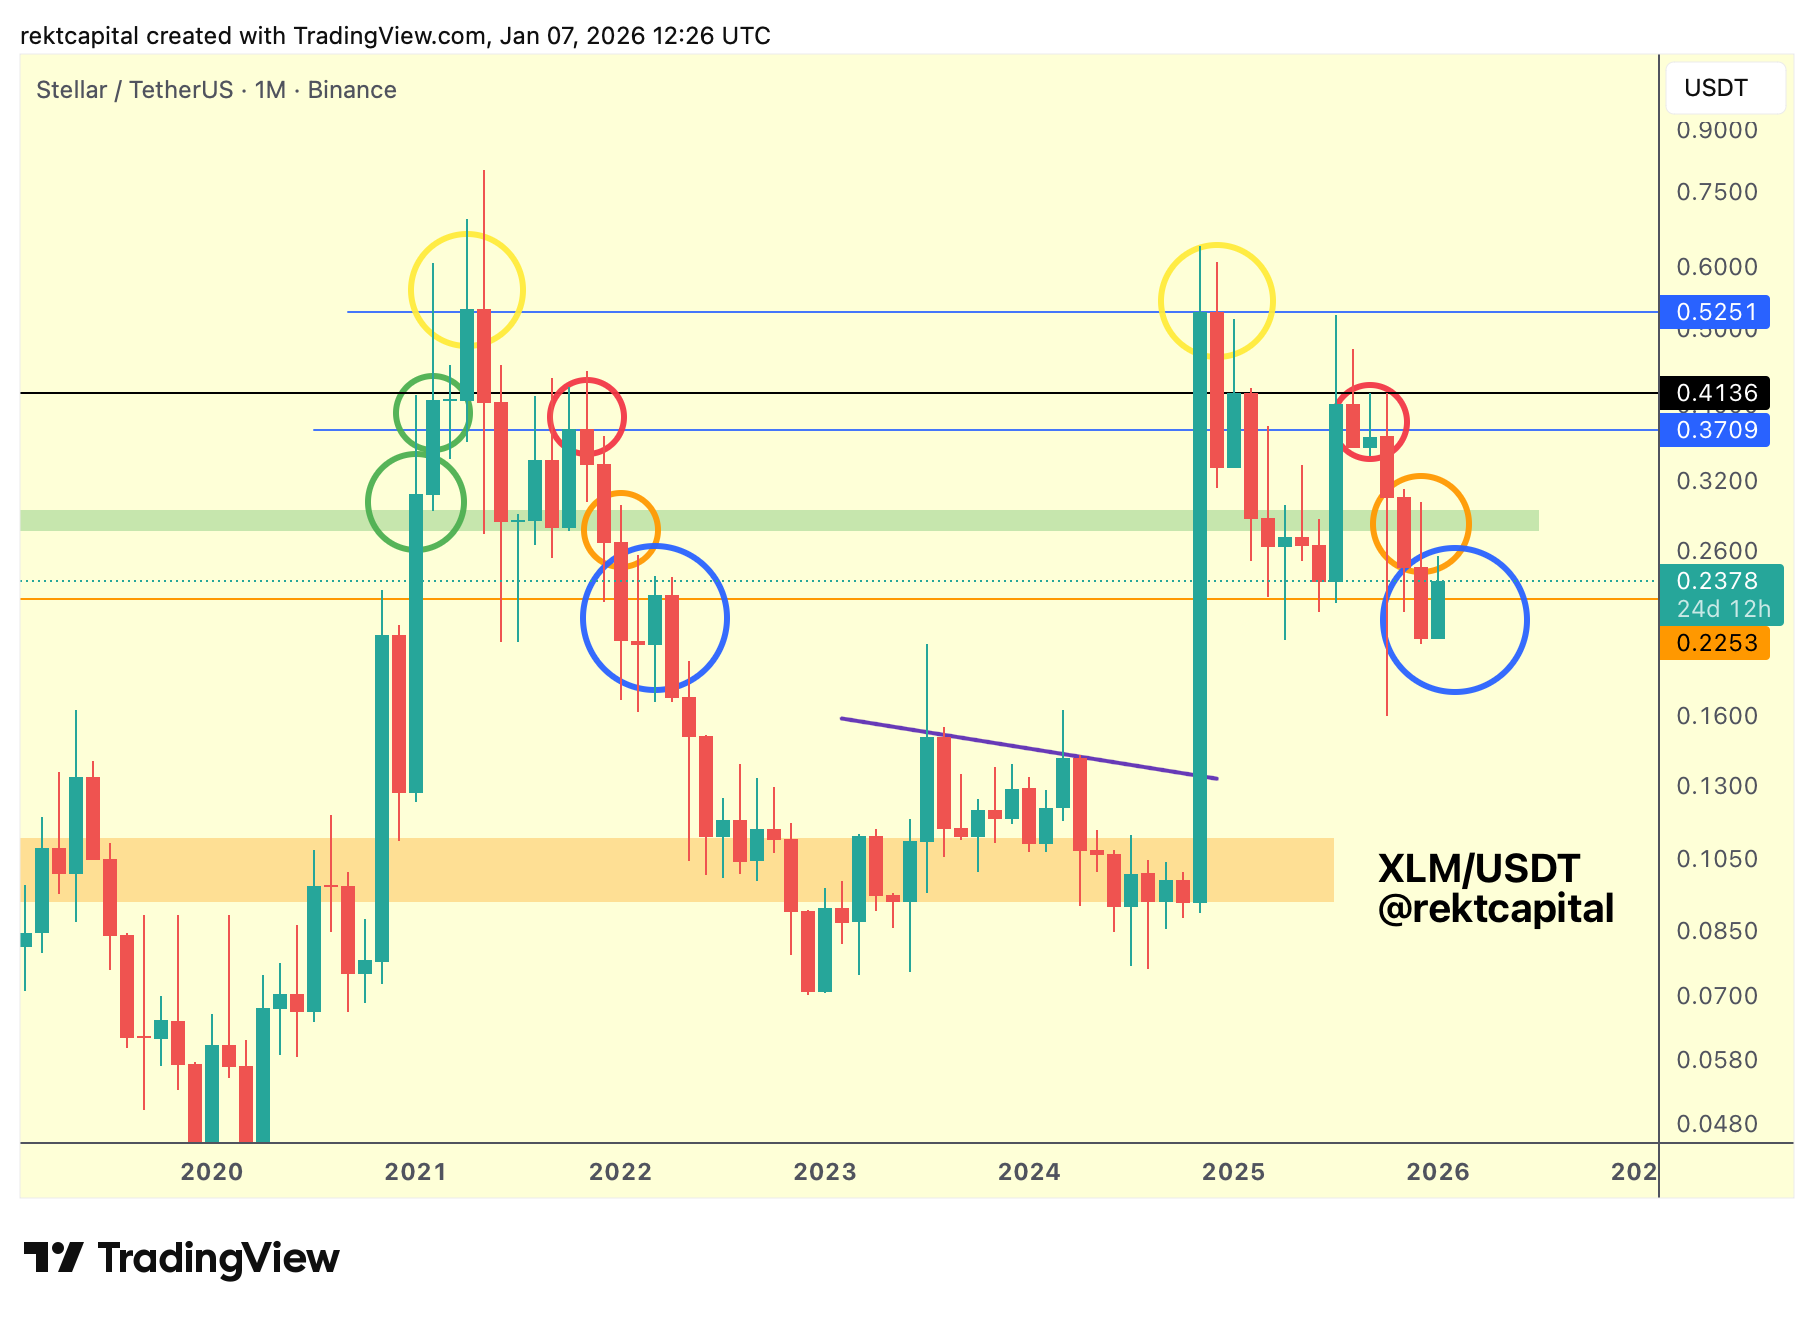
XLM continues to track its 2021 historical tendencies closely, following the same sequence of topping behaviour and subsequent Lower High resistance checks at identical price levels.
In both cycles, price formed a yellow-circled topping structure, followed by a red-circled Lower High, and then an orange-circled Monthly Close with an upside wick into the green region that ultimately resolved into downside continuation.
This cycle has adhered to that roadmap with notable consistency.
XLM has now transitioned into the blue-circled phase of the structure.Having already registered a Monthly Close below $0.225 (orange horizontal), which historically marked the beginning of an extended period of upside wicking rather than immediate trend continuation.
Even though the current candle is trading above the orange level, historical behaviour suggests this region can still flip into resistance, allowing price to consolidate and churn around this area for a few more months.
For the fractal to be invalidated, XLM would need to Weekly Close and Monthly Close back above $0.225 and successfully reclaim it as support.
Without those confirmations, the broader historical fractal remains intact, keeping the structure biased towards continued consolidation in the mid-term and then downside continuation over time.