A Story of Re-Accumulation Ranges
The Re-Accumulation Range & The Downside Deviation Area
Welcome to the Rekt Capital Newsletter, a resource for investors who want to better navigate the crypto markets with the help of cutting-edge crypto research and unbiased market analysis
Bitcoin's Monthly Bull Flag
We're familiar with Bitcoin's Monthly Bull Flag, discussed in late January:
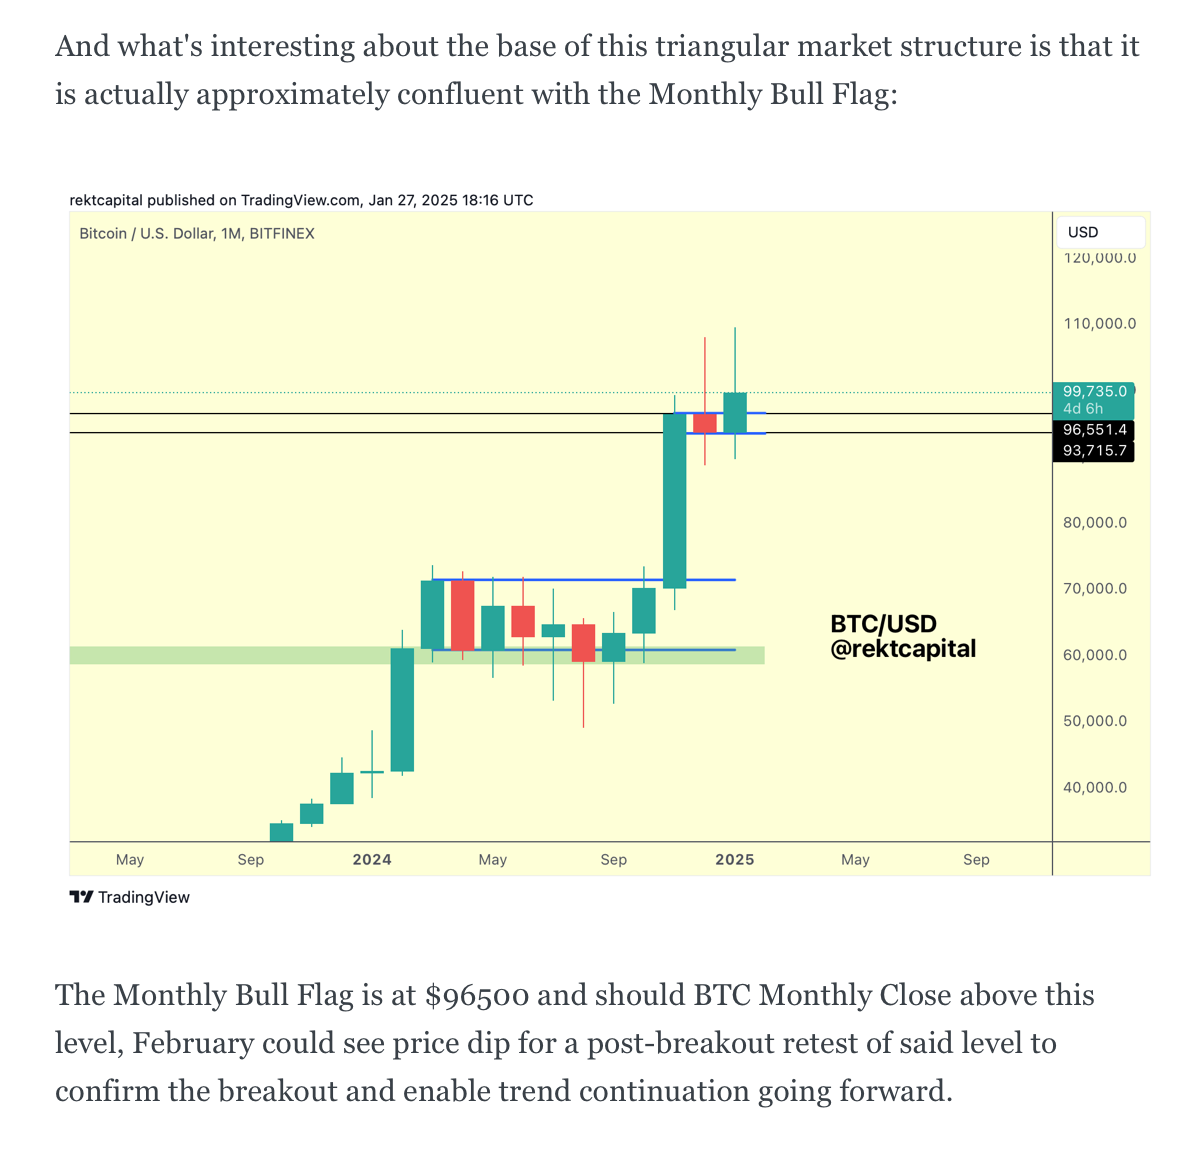
And the post-breakout retest is now in progress:
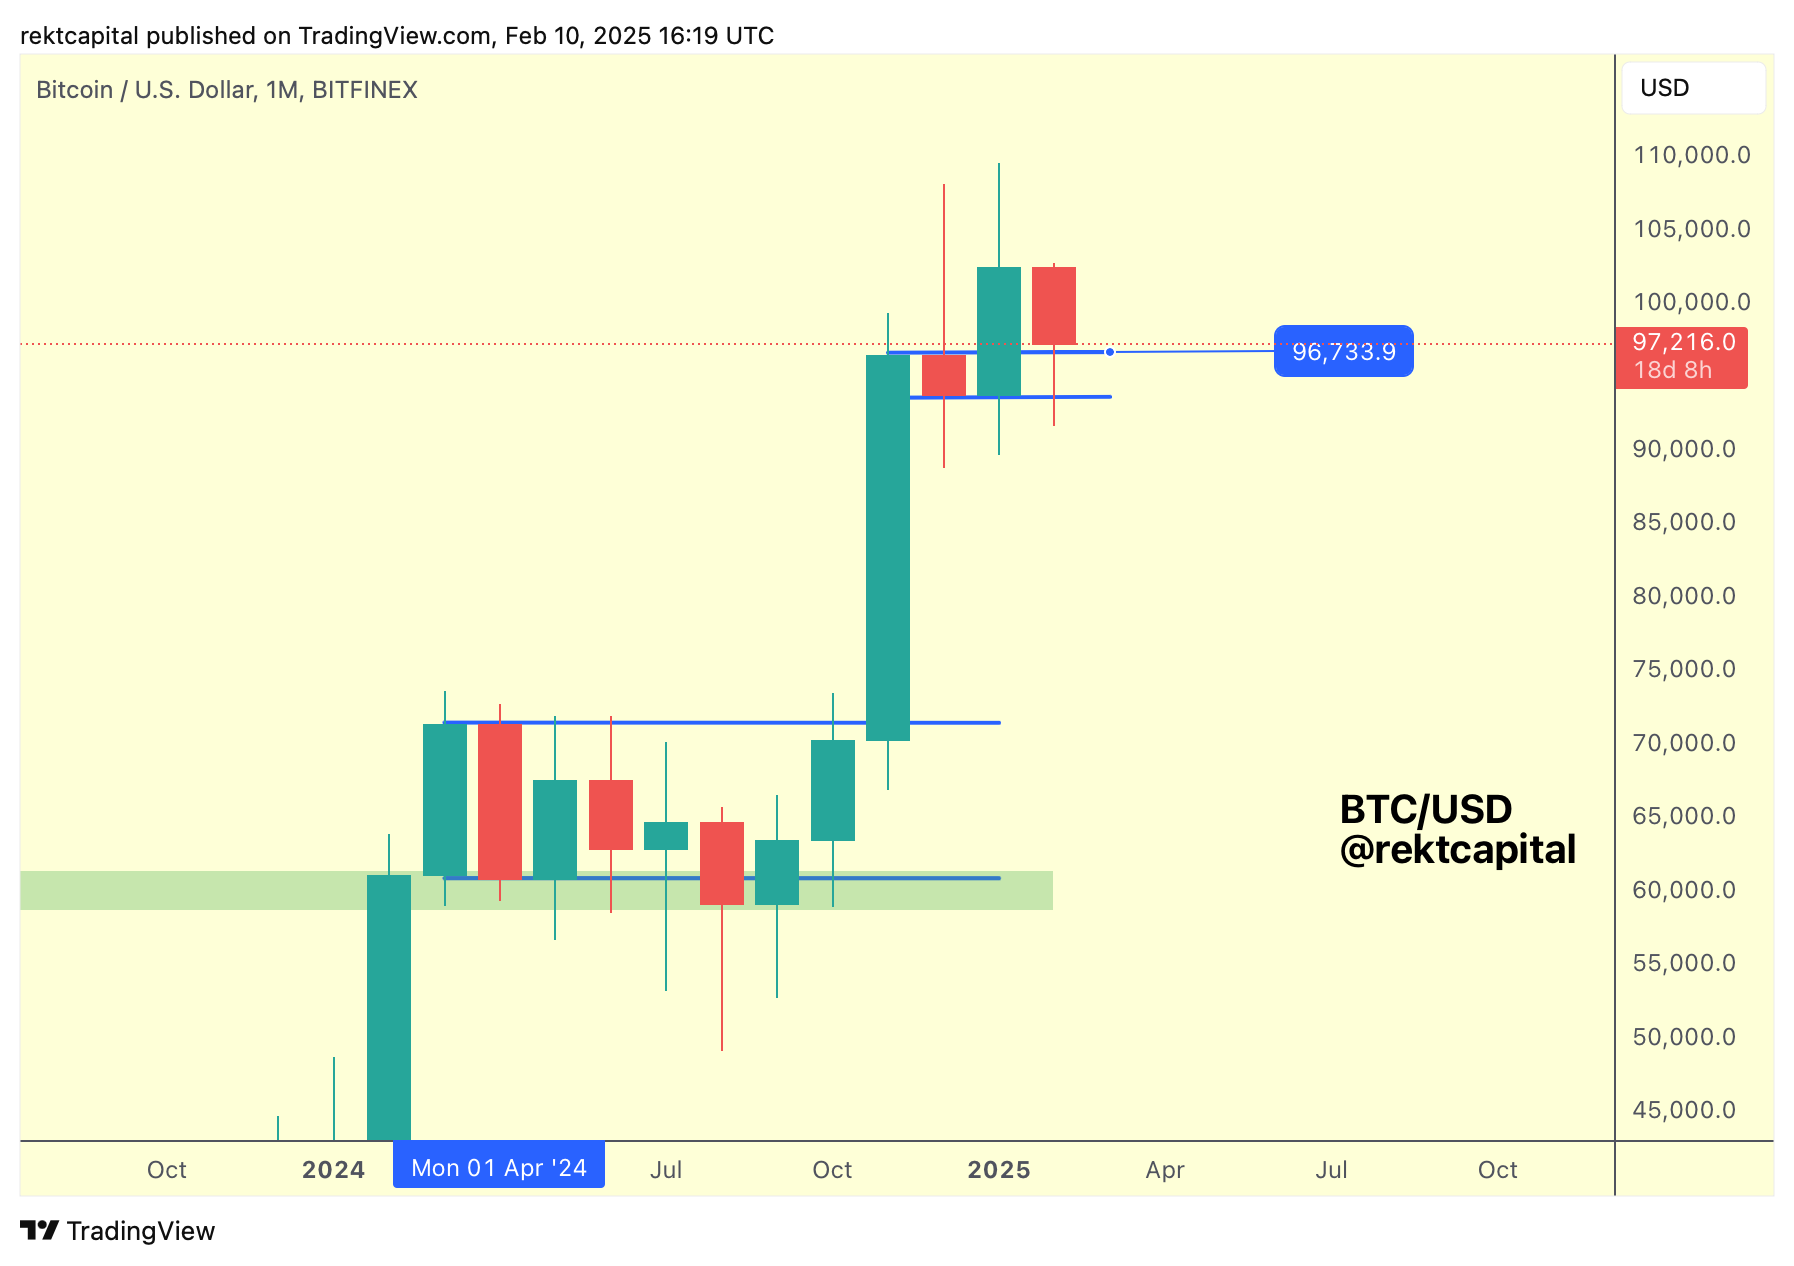
BTC needs to hold this level as support to confirm a successful breakout from the Bull Flag to then ensure trend continuation to the upside.
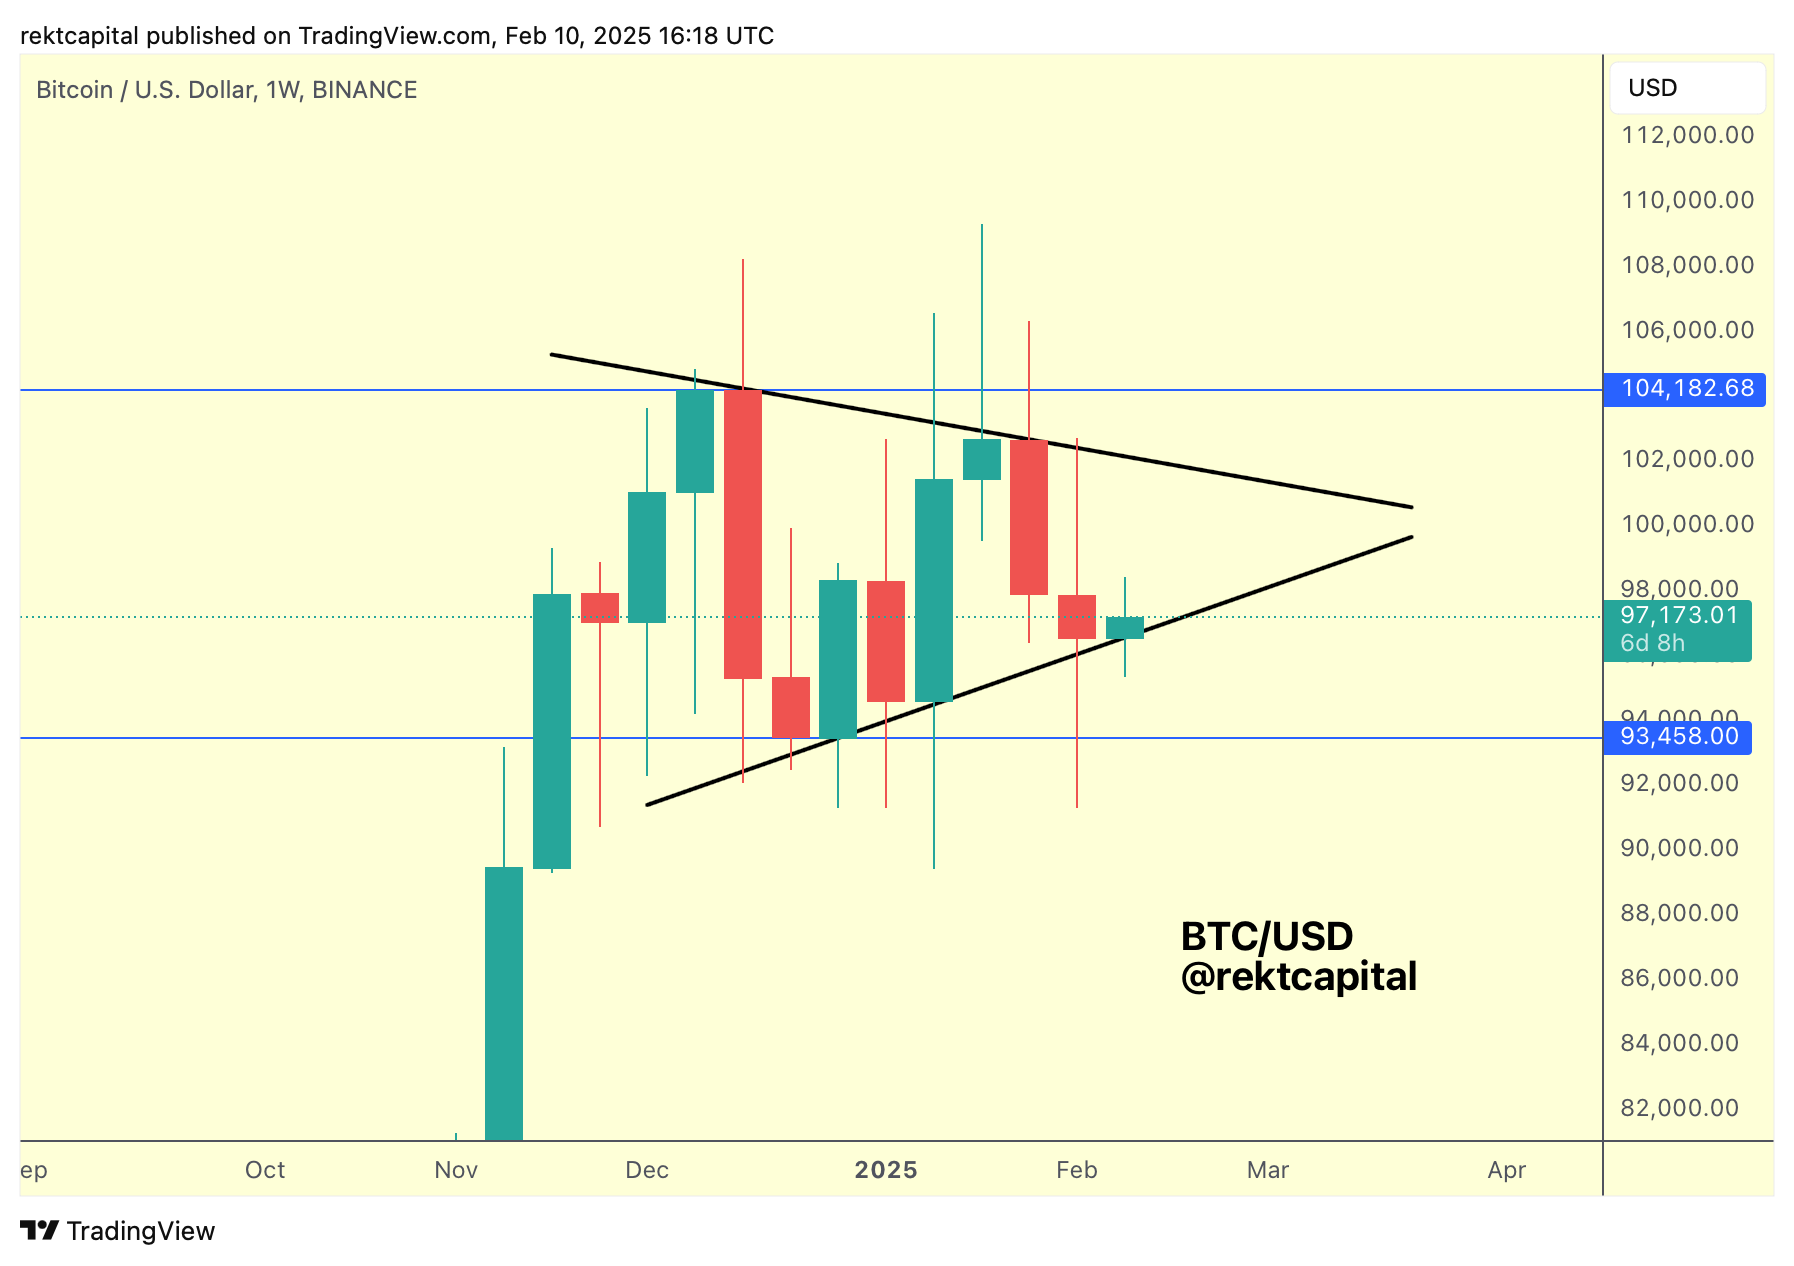
And a big part of that post-breakout retest being successful is the Weekly triangular market structure continuing to hold:

And at the moment, the Higher Low is still holding as support.
Granted, many downside wicking moments do tend to occur around here but as long as price continues to Weekly Close above the Higher Low, then any downside deviations would be temporary while maintaining general price positioning within the pattern.
That being said, the triangular market structure exists within a Weekly Range overall:
And that's no coincidence because this Bitcoin cycle has been a story of Re-Accumulation Ranges thus far.
A Story of Re-Accumulation Ranges
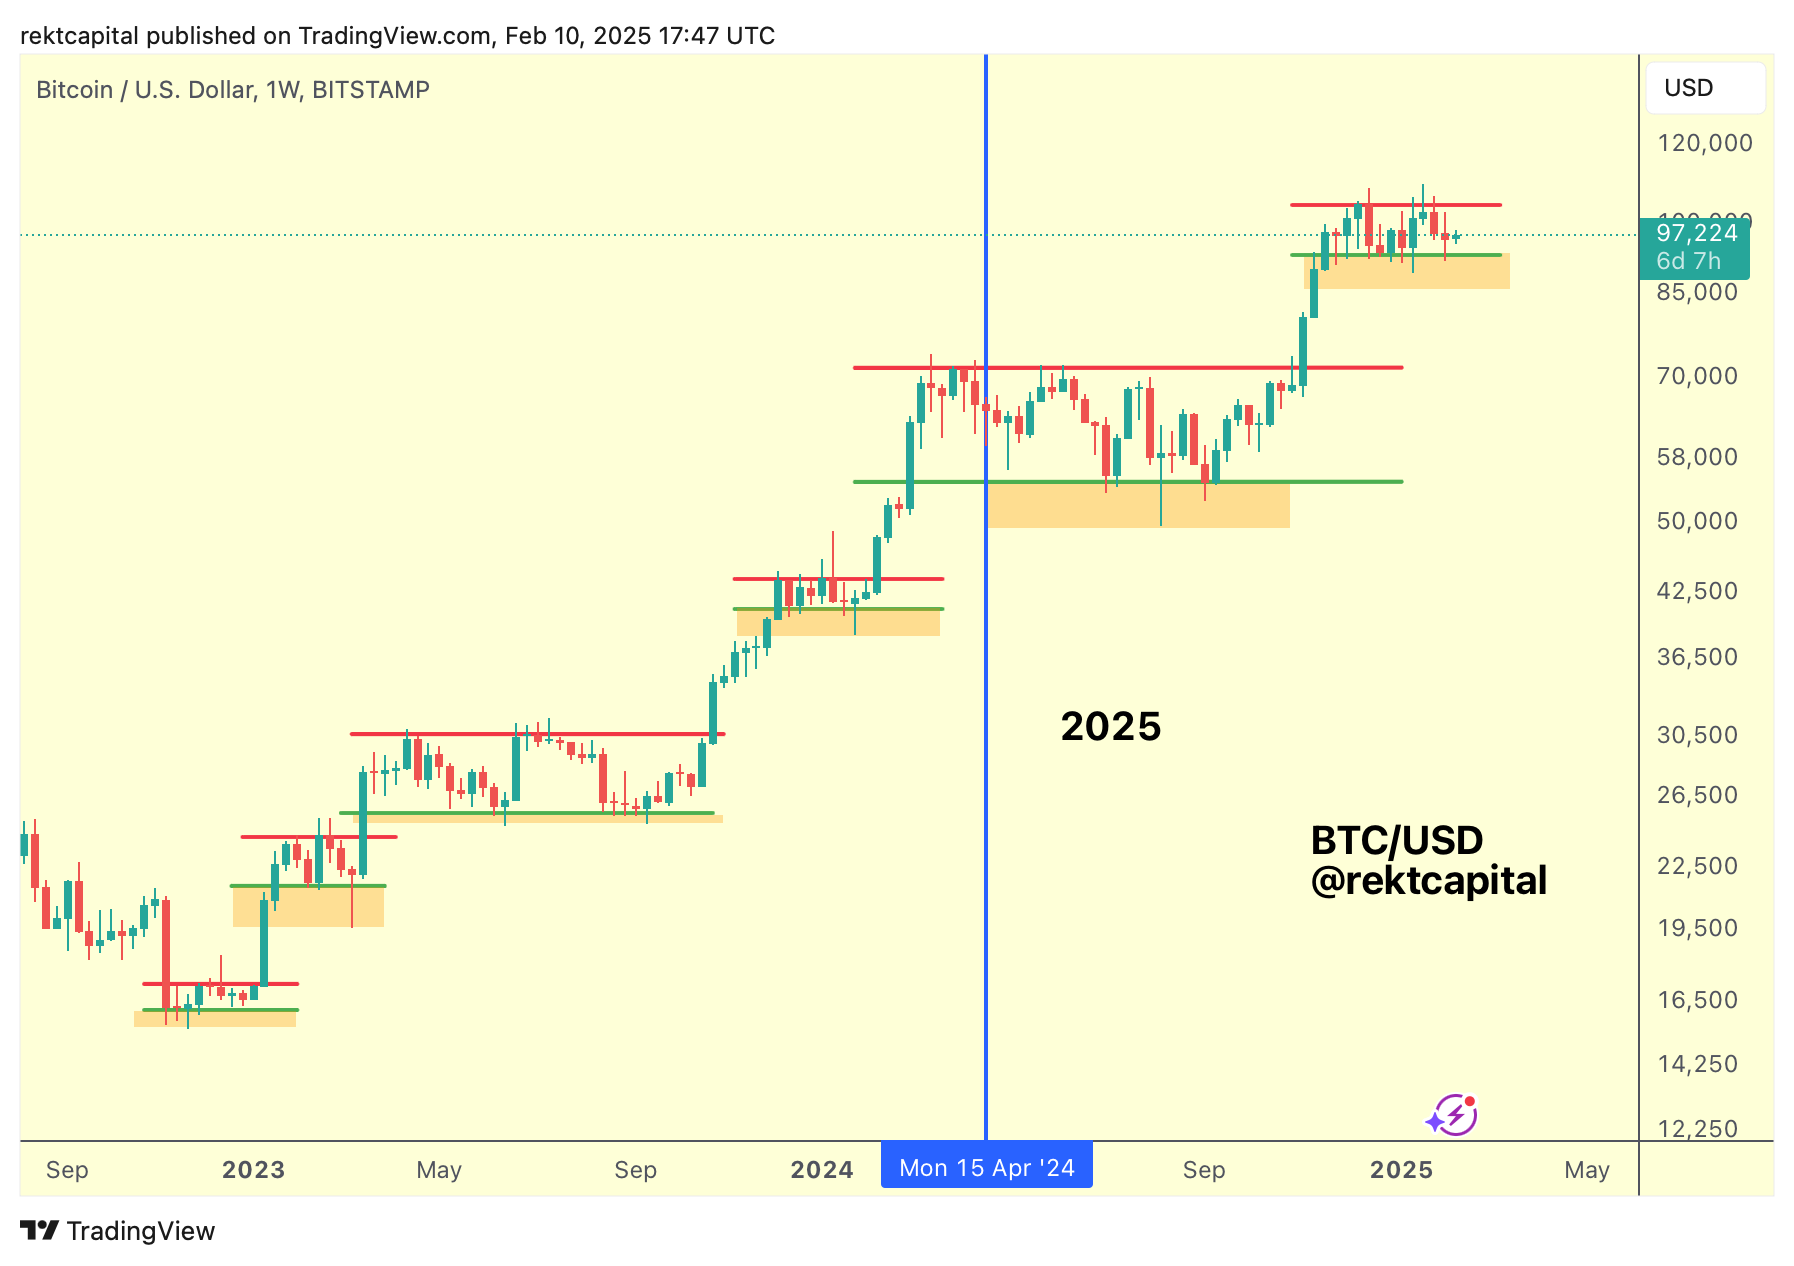
This has been an idea I've been posting on X for a while whereby BTC has been developing ReAccumulation structures all cycle long:
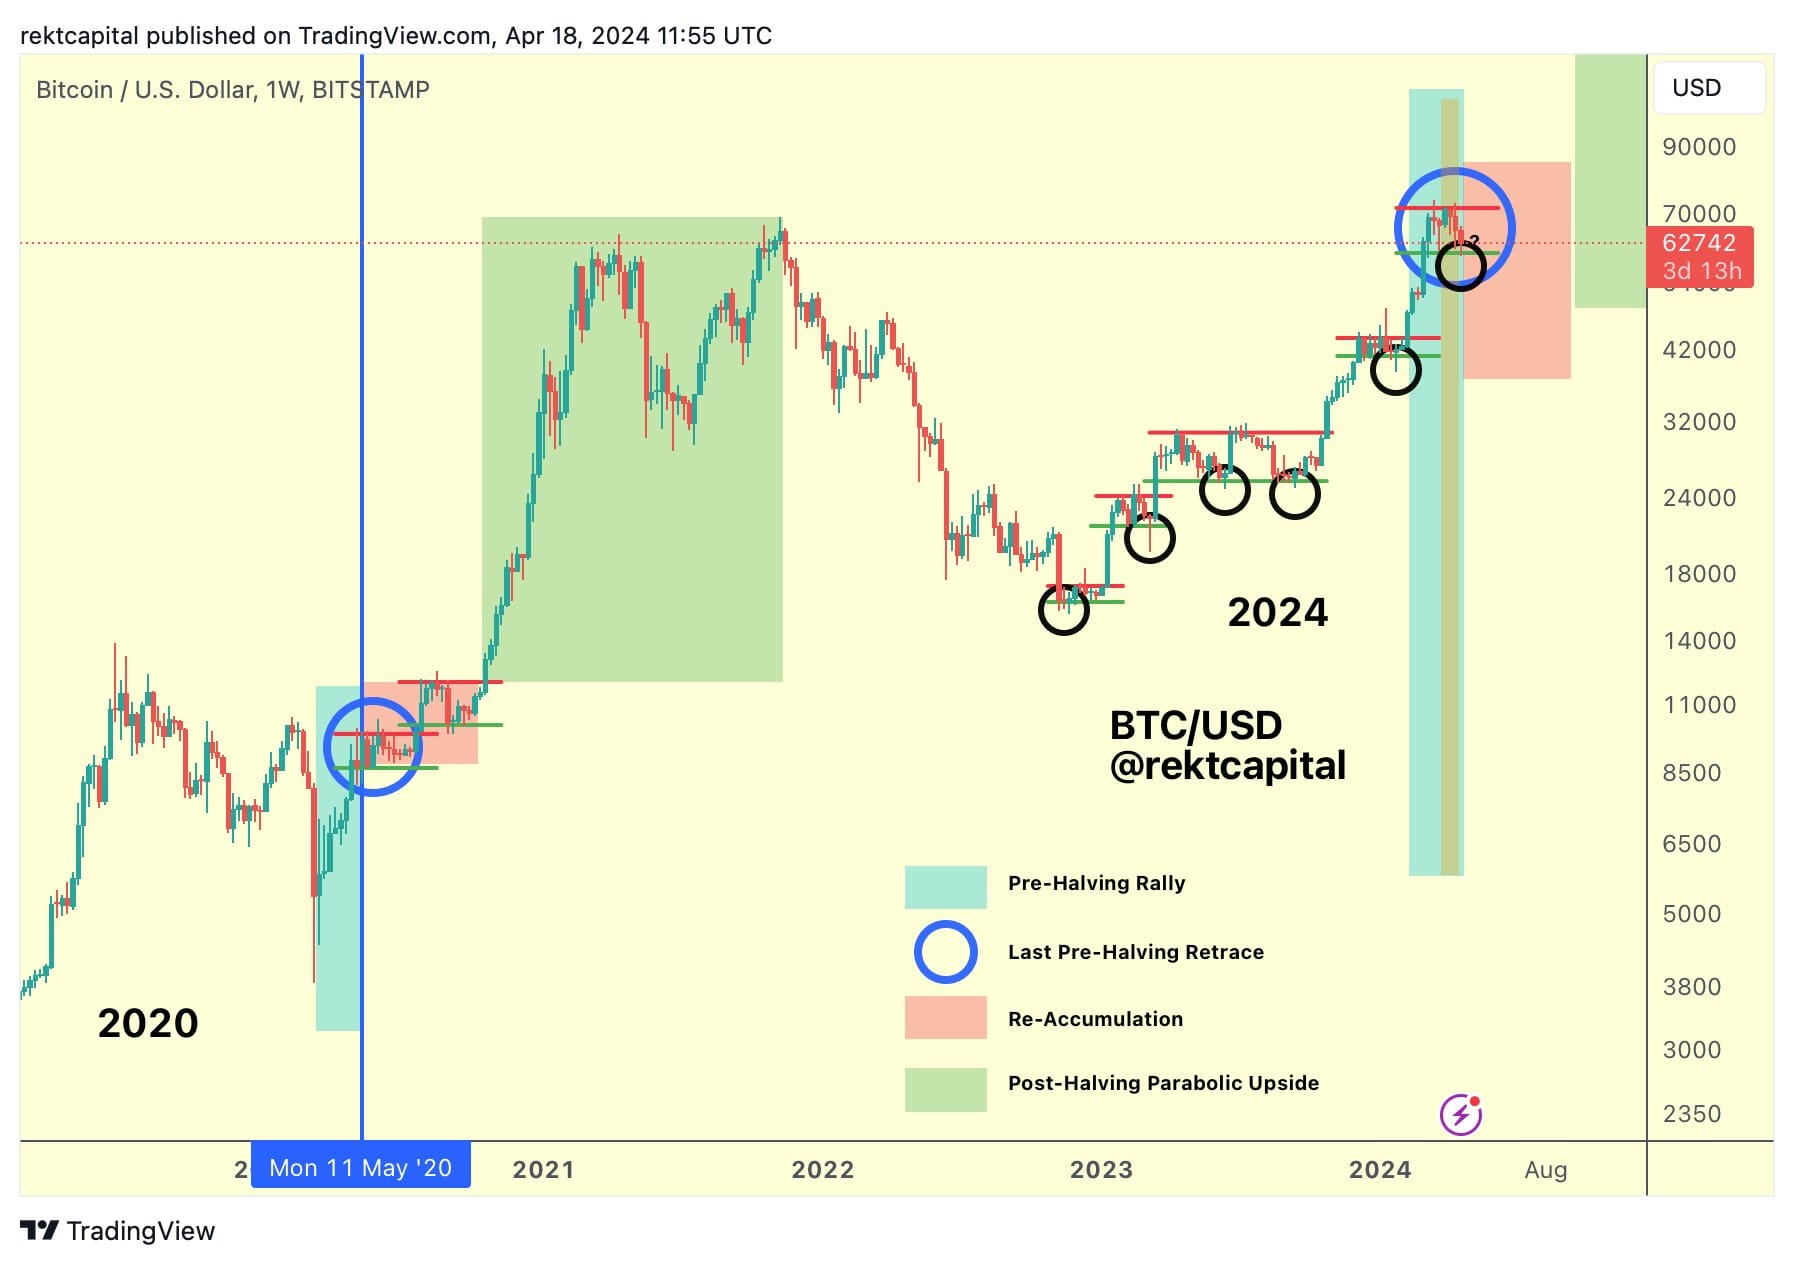
And any downside deviations below them would be bargain-buying opportunities (black circles).
With the above chart from April 2024 signalling an outsized opportunity for BTC below ~$60000 and price currently being around $97000 at the time of this writing, the historically recurring price tendencies throughout the cycle clearly continue to persist.
And if they continue to persist even more so, as they most likely will, then any downside deviations below the current Weekly Range Low would also represents a bargain-buying, outsized opportunity for Bitcoin:
After all, Bitcoin is currently ranging yet again.
And already some of downside deviations have occurred, mainly in downside wicking form.
The maximum pain scenario would be for BTC to continue teasing a loss of the current range, downside deviating into the orange area, scaring investors into capitulation, before reclaiming the range only to breakout from it overall and continue into a brand new uptrend into Price Discovery.
Overall, Bitcoin is consolidating until further notice and it's likely that any and all downside deviations below the Re-Accumulation Range Low would be temporary before price resumes its uptrend.